Important Notes:
30 January 2026
Hui Min Ng, Portfolio Manager
Derrick Heng, Portfolio Manager


After posting positive performance in 2025, Asia Pacific ex-Japan REITs (AP REITs) are set for a pivotal transition from a period of rate-driven relief to a phase of growth revival. In this 2026 Outlook, Portfolio Managers Hui Min Ng and Derrick Heng analyse how declining interest rates are opening two avenues of growth for the asset class – organic growth via interest cost savings and inorganic growth via capital recycling. Additionally, the team explains how catalysts such as favourable historic relative valuations and positive policy changes in regional exchanges enhance the attractiveness of AP REITs for investors, ending with sectors that the team favours for the new year.
In our 2025 Outlook, we observed that heightened volatility in US interest-rate expectations has weighed on asset-class sentiment since mid-2022.
However, in 2025, this challenge has receded, and the ongoing rate-cutting cycle is materialising as strong tailwinds for AP REITs.
Despite uncertainty in the US interest-rate trajectory, domestic refinancing levels in key Asian REIT markets have continued to decline in 2025 – an important fundamental driver for AP REITs that opens two avenues for distribution per unit (DPU) expansion: organic and inorganic growth.
From an organic growth perspective, lower local rates are expected to drive interest cost savings among AP REITs, which would support bottom-line DPU growth amidst healthy net property income (NPI).
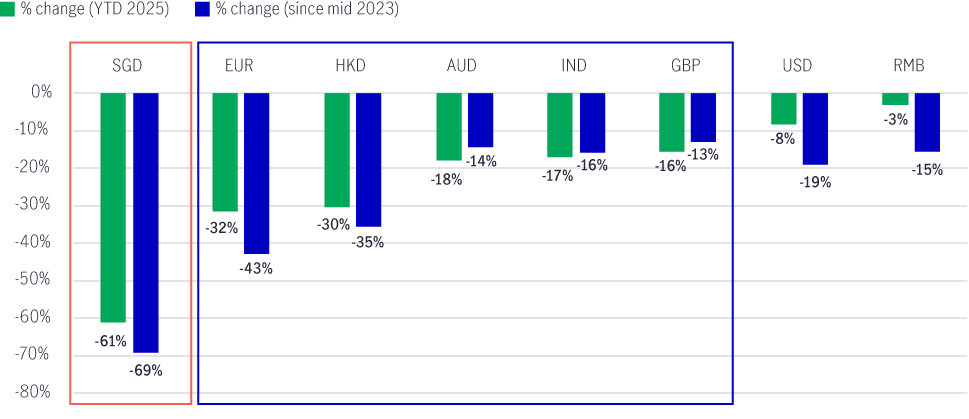
In 2025, year-to-date (YTD), local interest rates in key Asia REIT markets have experienced one of the sharpest declines amongst global markets (Chart 1).
Chart 1: Key global benchmark rates1
To understand how interest cost savings are expected to be felt across AP REITs, it is helpful to dissect the debt profiles of our portfolio’s REIT holdings.
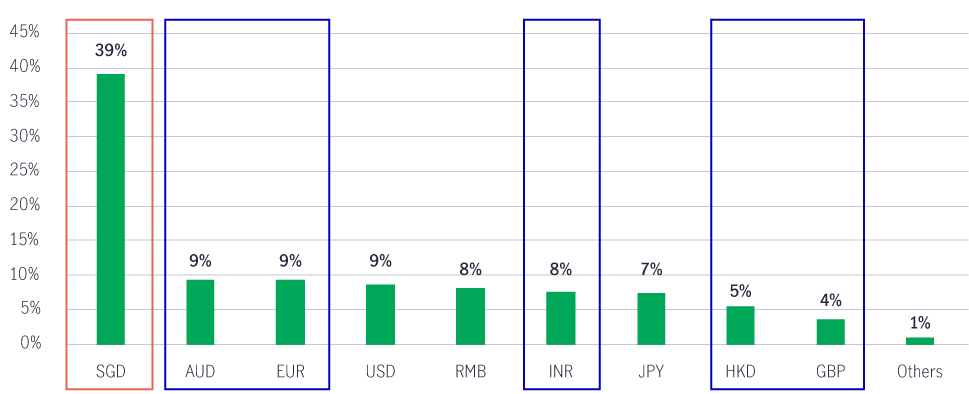
- In terms of the debt’s denominated currency:
Our portfolio’s REIT holdings reveal a high exposure to markets with sharp interest-rate declines (Chart 2). Around 39% of the underlying debts are in Singapore dollars, where rates have dropped by more than 180 basis points (bps) YTD and by 260 bps since the mid-2023 peak, bringing rates down from 3.8% to 1.1%. Approximately 35% of the underlying debts are in other currencies with sizable rate declines.
Chart 2: MGF AP REIT Fund’s REIT holdings – Debt by denominated currency2
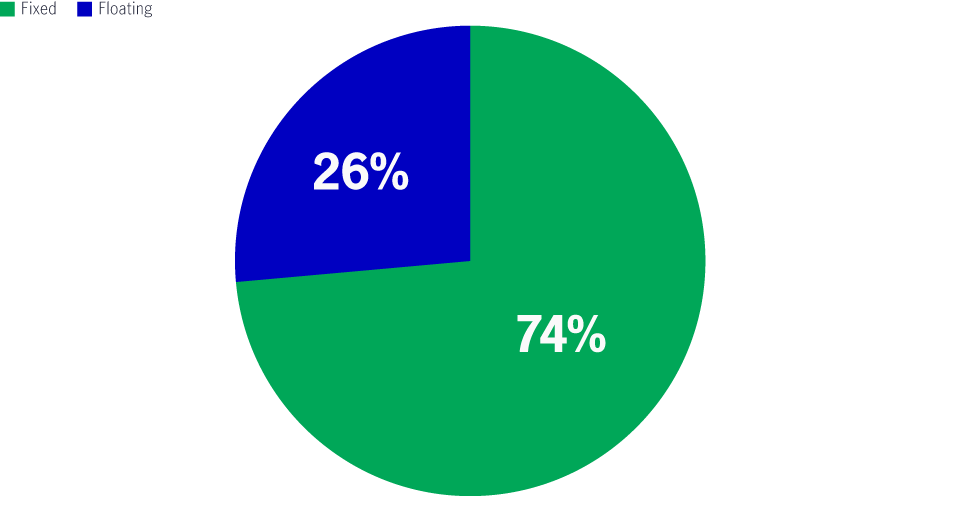
- In terms of the debt’s floating/fixed-rate split:
Around 26% of the Fund’s underlying debts are floating rate, which are set to enjoy immediate interest-saving benefits (Chart 3). Based on a sensitivity analysis, a 100 bps decline in the floating rate represents approximately 4% upside to DPU, on average, for broader Singapore-listed REITs (SREITs)3. This market posted the sharpest decline in cash rates.
Chart 3: MGF AP REIT Fund’s REIT holdings – Debt by fixed / floating-rate4
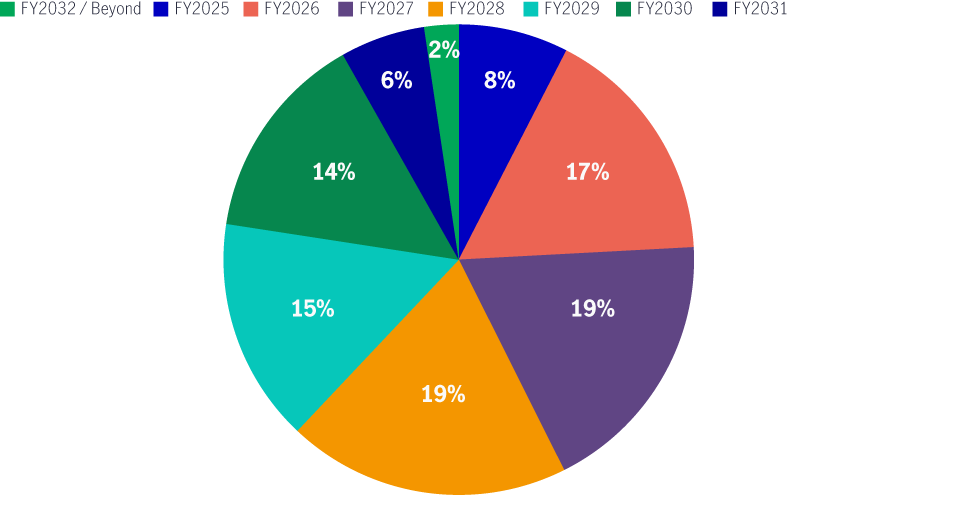
- In terms of the debt’s maturity:
Around 43% of the Fund’s underlying debt is due for refinancing within the next two years, offering near-term interest savings (Chart 4).
These rate tailwinds have started to materialise, as evidenced by the most recent quarterly earnings.
SREITs have seen an average decline of 20-30 bps in the cost of debt, year on year, as of the third quarter (Q3) of 2025, while most SREITs guided for further interest savings for the full year 20265.
As REITs continue to roll off their legacy, higher-cost debt, this provides room for DPU growth to resume over the next two years.
Chart 4: MGF AP REIT Fund’s REIT holdings – Debt by maturity6
From an inorganic growth perspective, a lower rate environment signals the end of cap-rate expansion and asset devaluation, thereby reviving DPU-accretive capital recycling among AP REITs.
In the high interest-rate environment from 2022 to 2024, real estate assets experienced cap-rate expansion (an increase in expected returns), leading to an asset devaluation cycle. High borrowing rates implied a limited yield spread for buyers and weighed on demand for real estate assets, leading to a freeze in real estate transaction activity.
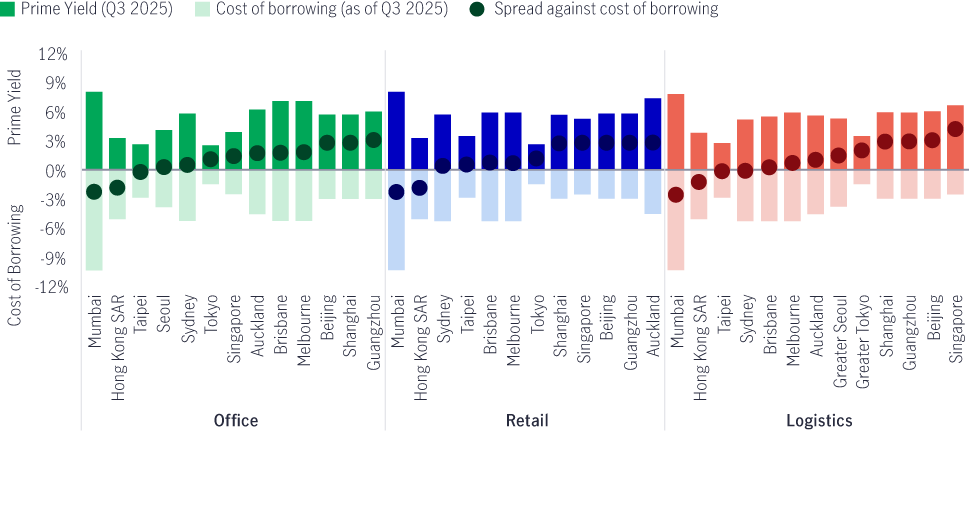
As interest rates decline, cap-rate expansion and asset devaluation cycles appear to have bottomed out, allowing net asset value (NAV) growth to more closely align with fundamental rental growth and supporting a more stable asset valuation environment.
Real estate assets in most key geographies and sectors are returning to positive yield spreads (Chart 5), even for some of the lowest-yielding asset classes, e.g. Singapore offices.
Chart 5: Real estate assets’ yield spreads are returning to positive7
The revival in the real estate transaction market is expected to 1) create opportunities for REITs to engage in DPU-accretive acquisitions and divest non-core assets for portfolio enhancement, balance sheet restructuring and capital redeployment, and 2) allow real estate fund managers to build larger fee-generating funds under management (FUM).
Real estate transaction activity YTD in key Asian markets has seen a notable pick-up (Chart 6), with the majority of key acquisitions by AP REITs expected to be DPU-accretive.
Chart 6: Pick-up in real estate transaction activities across Asia Pacific8
![]()
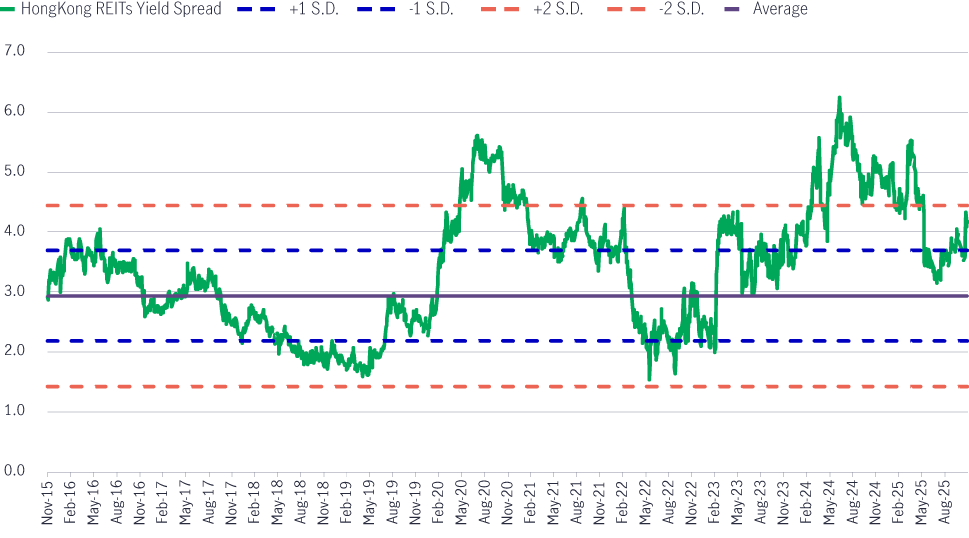
Other than DPU growth from organic and inorganic funnels, a lower rate environment also enhances the yield appeal of AP REITs from a relative valuation perspective. Despite the 2025 rally, key markets, such as Singapore and Hong Kong, are still trading well above the 10-year average in terms of yield spreads against local government bond yields (Charts 7 and 8).
Chart 7: Singapore REITs' yield spread versus government bond yield9
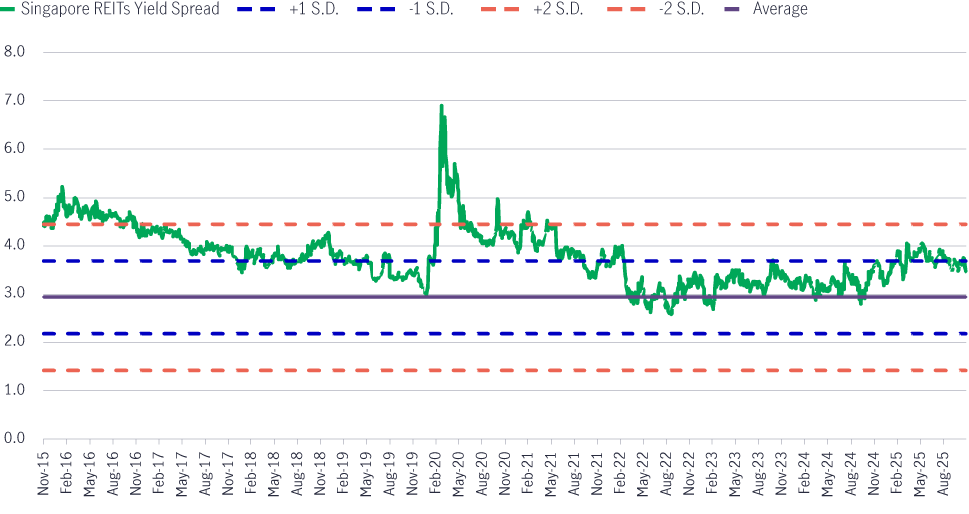
Chart 8: Hong Kong REITs' yield spread versus government bond yield10
In addition to favourable interest rate tailwinds, we also expect supportive government measures across the region to potentially lift market liquidity and investor interest for REITs and the property sector.
Singapore’s ongoing capital market reforms, unveiled in late 2024, are poised to provide a strong boost to small- and mid-cap stocks (SMIDs) listed in Singapore, with REITs being a key beneficiary.
Despite being one of the largest REIT markets in Asia Pacific ex-Japan, approximately 70% of the 40 listed SREITs fall into the small-cap segment (market caps below SGD $3 billion), demonstrating ample potential for the universe to grow.
Key initiatives include:
The deployment of EQDP funding and potential ETFs linked to the new index are expected to enhance market liquidity and fund flows for REITs and property sectors.
Supportive value-up initiatives and increased vibrancy in the real estate transaction market also support new REIT listings.
In 2025, SREITs’ IPO activity resumed after a three-year freeze, with two new listings and over US$1.3 billion raised, marking one of the highest annual amounts of capital raised from IPOs in the past decade. Capital market revival is expected to expand the SREIT investment universe, forming a virtuous cycle that attracts further investor interest.
Over the past two years, government authorities have signalled support through ongoing consultations and technical preparations for the inclusion of REITs as eligible investments in the Hong Kong/Chinese Mainland Stock Connect.
We believe the successful implementation of this initiative would broaden investor base and open the door to fund flows into Hong Kong REITs, given that it is well positioned as a compelling income solution for Chinese Mainland investors.
Hong Kong REITs differ from Chinese Mainland REITs. Chinese Mainland REITs are primarily designed as financing tools for public infrastructure projects with dividend yields of around 3-5%. In contrast, Hong Kong REITs aim to generate income from commercial real estate, offering post-withholding tax dividend yields of approximately 5-6%12.
Such strong relative yield appeal is expected to drive potential re-rating and yield compression among Hong Kong REITs as fund flows materialise.
With the first REIT listed in 2017, India is emerging as a regional REIT market. The Securities and Exchange Board of India (SEBI) has announced the reclassification of India REITs from hybrid instruments to equity instruments, effective 1 January 2026.
It is a pivotal milestone that aligns India’s REIT ecosystem with global standards, which is expected to broaden investor participation and enhance market liquidity for Indian REITs.
Key benefits include:
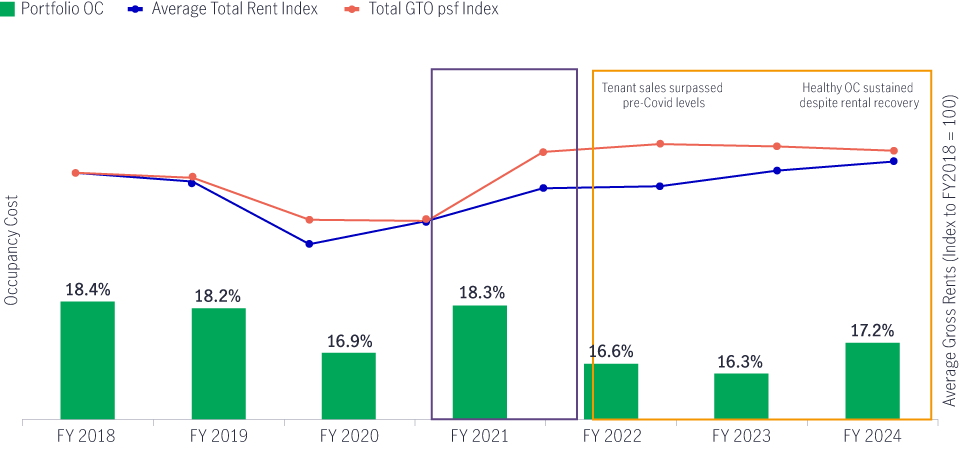
Chart 9: Retail assets managed by a leading Singapore retail landlord14
Real estate fund managers stand to be key beneficiaries of lower interest rates, marking a pivotal inflexion point for the sector.
1. Revival of transaction activities, enabling the resumption of net asset acquisitions.
2. Stabilisation of property asset values, driving revaluation gains.
3. Lower funding costs are creating capacity for higher capital expenditure (capex) across development and refurbishment pipelines.
1. The resurgence in real estate investment across Asia Pacific is fuelled by both domestic and foreign capital. Over the 12 months ending Q3 2025, more than US$45 billion of ex-Asia-Pacific capital flowed into the region, compared with less than US$19 billion of cross-border capital originating within Asia Pacific.16
While our base case assumes a continued downtrend in global and regional interest rates, volatility on rate expectations remains a risk that could weigh on sentiment for AP REITs, as key central banks stay watchful of any upside surprise in inflation.
Despite expectations of rental reversion remaining positive, high base effects from strong post-pandemic rental uplifts in 2023–2024 may temper the pace of reversion going forward. During economic uncertainty, landlords may also prioritise occupancy stability over rent hikes. That said, we believe the risk of a major deterioration in occupancy or rental rates remains minimal going into 2026, barring a recession.
1. The Johor (Malaysia)-Singapore Rapid Transit System link (expected by the end of 2026) might divert some discretionary spending across the border. However, the impact is likely to be less than the Shenzhen-Hong Kong dynamics.
2. The high base effect from SG60 consumption vouchers (disbursed in July 2025) may slightly normalise tenant sales growth in the absence of similar stimulus in 2026.
1. Early signs of recovery in the macro environment and broader consumption still take time to be reflected in headline rental reversion, given a typical three-year leasing cycle.
2. Potential competition from Chinese Mainland e-commerce players could affect offline retail sales.
1. Uncertainty in the AI monetisation path might impact investments, expansion plans and leasing activities in data centres.
AP REITs are entering a pivotal phase as interest rates decline, unlocking both organic and inorganic growth opportunities. Coupled with compelling yield spreads and supportive policy measures, AP REITs can offer an attractive risk/reward profile for investors seeking resilience and potential upside in a lower-rate environment. The investment team remains focused on active portfolio management to navigate uncertainty and capture growth in 2026 and beyond.
1 Source: Bloomberg, as of 30 November 2025. Note: Reference rates are: SORA (Singapore), EURIBOR (Eurozone), HIBOR (Hong Kong), BBSW (Australia), MIBOR (India), SONIA (UK), SOFR (USA), LPR (China).
2 Source: Manulife Investment Management, company data, as of 30 November 2025. Note: Data covers the portfolio’s REITs holdings only and excludes fund managers/non-REIT holdings.
3 Source: JP Morgan estimates, as of 11 March 2025
4 Source: Manulife Investment Management, company data, as of 30 November 2025. Note: Data covers the portfolio’s REITs holdings only and excludes fund managers/ non-REIT holdings.
5 Source: Company data, as of Q3 2025. ‘SREITs’ refer to MGF AP REIT Fund’s Singapore-listed REITs holdings.
6 Source: Manulife Investment Management, company data, as of 30 November 2025. Note: Data covers the portfolio’s REITs holdings only and excludes fund managers/ non-REIT holdings.
7 Source: CBRE Research, as of Q3 2025.
8 Source: Bloomberg, as of Q3 2025.
9 Source: Bloomberg, as of 30 November 2025. Singapore REITs’ dividend yield is represented by FTSE ST All-Share Real Estate Investment Trusts Index. Government bond yield is represented by Singapore’s 10-year government bond.
10 Source: Bloomberg, as of 30 November 2025. Hong Kong REITs’ dividend yield is represented by FTSE EPRA/ Nareit Developed REITs Hong Kong Index. Government bond yield is represented by Hong Kong’s 10-year government bond.
11 Source: Monetary Authority of Singapore, Singapore Exchange.
12 Source: Bloomberg, as of 28 November 2025. Note: Hong Kong REITs refer to constituents of the Hang Seng REIT Index. Post-tax dividend yield is the dividend yield considering assumption of 20% withholding tax currently applicable on Hong Kong-listed stocks’ dividends for Chinese Mainland investors.
13 Source: Securities and Exchange Board of India.
14 Source: JP Morgan, Capitaland Investment, as of 18 November 2025. Note: Average total rent index and total GTO psf index are indexed to 2018=100. Rents are total, inclusive of fixed GTO, service charge & A&P fees. OC is total rent divided by total sales.
15 Source: CBRE Research, as of Q1 2025. Healthy occupancy cost (LHS) & Tenant sales growth outpacing rent growth (RHS).
16 Source: PWC, Urban Land Institute, Asia Pacific Emerging Trends in Real Estate 2026.
2026 Mid-year outlook: Asian Fixed Income
In this Mid-Year Outlook, the Asian Fixed Income team explains this important change in monetary policy expectations, and why the asset class is well positioned to capitalise on it.
2026 Mid-year outlook: Greater China Equities
Greater China equity markets showed divergent trends in the first half of 2026, with China A-shares and the Taiwan Taiex index registering strong gains driven by resilient technology exports amid global demand for artificial intelligence (AI). Meanwhile, the MSCI China market pulled back, weighed by commerce subsidies amid fierce competition in food delivery and rising AI capital expenditure, which we believe have already been priced in. In this mid-year Outlook, we highlight five positive drivers for China and Hong Kong equities in the second half of the year. Furthermore, the team explains why it believes the Taiwan region’s technology sector should continue to enjoy positive momentum.
2026 Mid-Year Outlook Series: Asia Equities ex-Japan
Asia equities ex-Japan continued the significant momentum from 2025 with strong performance throughout the first half of the year. Amid numerous catalysts, June Chua, Head of Asia Equities outlines in this Mid-Year Outlook why she is constructive on the asset class for the remainder of 2026. Positive drivers include: potential geopolitical resolution in the Middle East and lower energy costs, supportive earnings and valuations, and differentiated growth drivers across the region.
![]()
©1999 - 2026 Manulife Investment Management (Hong Kong) Limited