20 September, 2019
Frances Donold, Chief Economist, Head of Macroeconomic Strategy

Wednesday’s US interest-rate cut represents a continuation of the global easing cycle. Our Chief Economist and Head of Macroeconomic Strategy Frances Donald takes a magnifying glass to the proceedings and identifies the key themes from the US Federal Reserve (Fed)communications and the problems that the central bank is facing.
The Fed delivered a 25 basis points (bps) interest-rate cut, a 30bps cut to its interest on excess reserves. Following Wednesday’s communications from the Fed, we believe that:
Critically, we believe there could be more rate cuts in the next 12 months that markets have yet to fully price in. In other words, we expect the Fed will need to move more aggressively in the future in order to play catch-up—particularly as we see a growing list of issues confronting the US economy.
China Fixed Income: From deflation to reflation: what comes next?
Not another bubble: How semiconductors are powering a real future
Semiconductors sit behind almost every modern experience – from smartphones and cars to cloud computing and today’s AI tools – yet they remain largely invisible to most people. They are more than chips only, and the demand is being supported by several long-term forces. We believe that today’s semiconductor excitement is not a repeat of the dot-com bubble, as investment is tied to real infrastructure and revenue-generating services. And the opportunity is broader than a handful of headline AI names.
Global Equity Diversified Income (GEDI) strategy update: Risks and opportunities
In early April, developments in the Middle East showed signs of stabilisation, prompting a partial recovery and renewed risk-taking in equity markets. However, beyond ongoing geopolitical risks, other factors—including potential private credit contagion across banks and broader financials—continue to pose downside risks. Despite these uncertainties, we believe an income centric approach, combined with global diversification across growth, value and income equities, has provided both downside resilience and upside participation for the Global Equities Diversified Income (GEDI) strategy.
Problem 1: the trade war is hurting the US growth outlook more than most—including us—had initially expected
Geopolitical tensions might have eased in the past two weeks, but they remain substantially more elevated today than they were on 31 July. Critically, US companies are facing more tariffs than at July’s FOMC meeting. Moreover, the US manufacturing outlook continues to deteriorate. The Federal Reserve Bank of New York’s estimate of Q3 GDP currently stands at around 1.6%, and it expects growth to slow to 1.1% in Q4.2 We agree with that assessment and believe that first-quarter growth next year could come in between 1.0% and 1.5%— hardly a stellar growth figure by any means.
Problem 2: geopolitical risks are amplified
Hong Kong protests, Brexit, Argentina, and the threat of a global oil supply disruption—recent headlines relating to these events suggest markets might have underpriced risk. Notably, barring the drone attack on oil refineries in Saudi Arabia, which has only just happened, tensions around these events have intensified since the last Fed meeting.
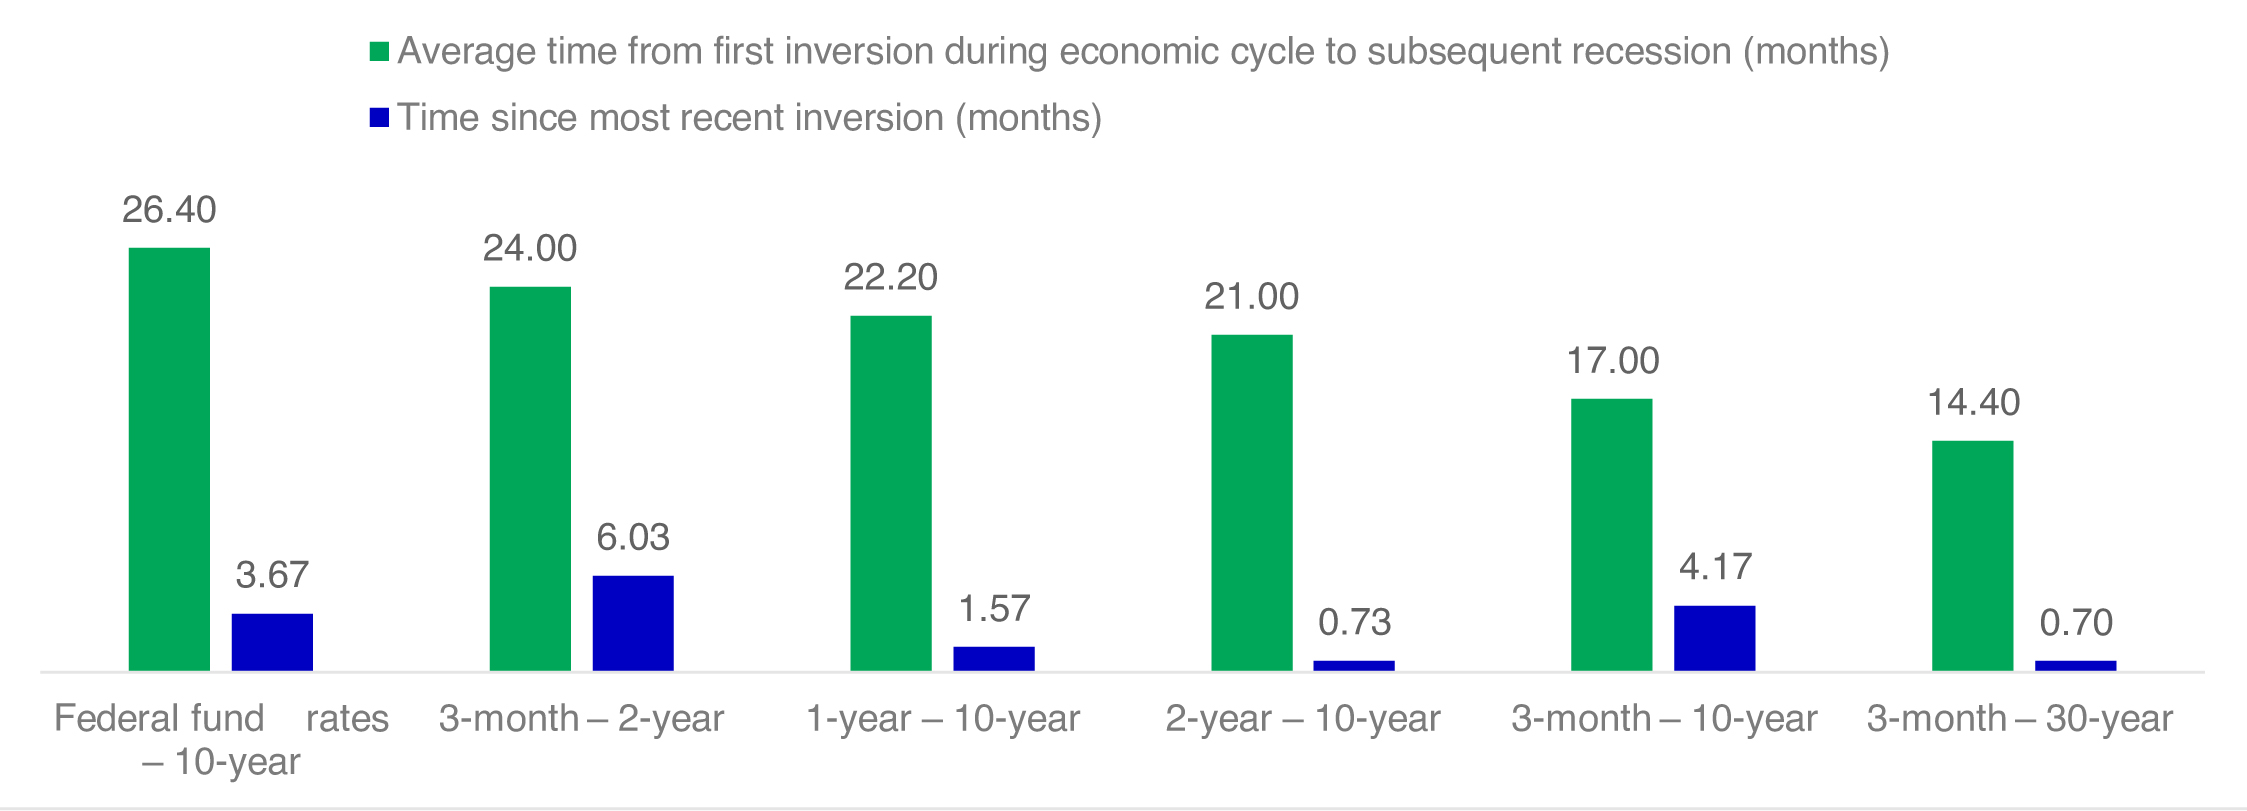
Problem 3: those pesky yield curves
Every major part of the US Treasury’s yield curve has now tipped into inversion. Even if some segments of the yield curve have recently bounced back into positive territory (such as the 2-year and 10-year),1 the elevated recession probabilities associated with the first inversion remain worrying. Moreover, the yield curve has now been inverted for longer than the periods during which it provided socalled false signals about an impending recession (Chart 1). While there are reasons to believe that the yield curve is distorted due to a compromised term premium, the Fed has historically misjudged the damage created by an inverted curve, and we don’t expect it to be comfortable with this level of inversion.
Problem 4: a strong US dollar hurts growth
The Fed has been clear that it isn’t targeting the US dollar (USD), but it’s safe to say that the central bank has incorporated the value of the tradeweighted dollar into its analysis for the following reasons. A strong USD:
The Fed’s past analysis has suggested that a 10% appreciation in the real trade-weighted dollar could cut US GDP by 0.5 percentage points. 3 With that in mind, we can’t help but notice that, on a tradeweighted basis, the greenback has gained 9% since the beginning of 2018.
Problem 5: inflation expectations are still struggling
Realised inflation has improved in the past three months: The three-month annualised core personal consumption expenditure (PCE) is nearing 2.0%.1 That should be good news, except that longer-term inflation expectations—the ones that drive the Fed’s forward-looking model—remain very weak. If the Fed wants the yield curve to steepen, it needs to convince markets that its actions will lead to higher inflation over time; a higher level of inflation at this juncture that’s accompanied by depressed long - term inflation expectations can only produce a flatter yield curve (and, more than likely, hurt central bank credibility).
Problem 6: stagflation risks are rising
Recent upside surprises in inflation might be thought of as positive news, but they’re occurring in an environment of weakening growth. An analysis of previous periods of stagflation shows that equities typically fare badly in an environment defined by slower growth and higher inflation— in other words, stagflation (Chart 2). In our view, stagflation is primarily a fourth quarter problem, with higher inflation in part being driven, in the short run at least, by tariffs that will drop out over time. Similarly, the subsequent demand-side shock associated with tariffs will also ultimately be deflationary over the medium term.
Given that the Fed has undershot its 2.0% inflation target for almost the entire duration of the current economic cycle, we expect it to prioritise growth concerns over inflation fears, at least for the time being. What this means: Hitting the inflation target should not, in our view, deter the Fed from introducing more interest-rate cuts.
Problem 7: job growth is decelerating
The US added 130,000 jobs in August—a reasonable number by most accounts, but it’s clear that the momentum behind job growth is slowing. Some commentators view it as a reflection of having too few people in the labour market, as opposed to having too few jobs; in other words, they believe that we’re simply running out of people to hire. The problem with this narrative is that job openings are also decelerating. The stagnation of wage growth around the 3.2% level also suggests the slowdown is likely to be more related to a slowing demand for workers.
What’s not a problem: the US consumer
There’s one shining light in the US growth picture, and it continues to be the US consumer: Consumer confidence is near historic highs, and retail sales have re-accelerated. Representing around twothirds of the economy, it’s tempting to say a strong consumer will help us overcome all of the above problems—it’s an attractive idea, except that consumer spending is a lagging indicator and has consistently performed well shortly before recessions.
While we aren’t calling for a recession, we’re inclined to put more weight on the issues we’ve listed so far than US household spending for now. We hope the Fed will do the same.
Source: Bloomberg, Manulife Investment Management, as of 9 September, 2019.

Source: Citi, as of 16 September, 2019. It is not possible to invest directly in an index. Past performance is not indicative of future results.
1 Bloomberg, as of 17 September, 2019.
2 “Nowcasting Report,” Federal Reserve Bank of New York, as of 13 September, 2019.
3 “The Effect of the Strong Dollar on US Growth,” Federal Reserve Bank of New York, 17 July, 2015.
China Fixed Income: From deflation to reflation: what comes next?
Not another bubble: How semiconductors are powering a real future
Semiconductors sit behind almost every modern experience – from smartphones and cars to cloud computing and today’s AI tools – yet they remain largely invisible to most people. They are more than chips only, and the demand is being supported by several long-term forces. We believe that today’s semiconductor excitement is not a repeat of the dot-com bubble, as investment is tied to real infrastructure and revenue-generating services. And the opportunity is broader than a handful of headline AI names.
Global Equity Diversified Income (GEDI) strategy update: Risks and opportunities
In early April, developments in the Middle East showed signs of stabilisation, prompting a partial recovery and renewed risk-taking in equity markets. However, beyond ongoing geopolitical risks, other factors—including potential private credit contagion across banks and broader financials—continue to pose downside risks. Despite these uncertainties, we believe an income centric approach, combined with global diversification across growth, value and income equities, has provided both downside resilience and upside participation for the Global Equities Diversified Income (GEDI) strategy.
![]()
©1999 - 2026 Manulife Investment Management (Hong Kong) Limited