
8 September 2022
Market volatility is unavoidable. Despite this, data shows that the number of years with positive returns is still higher than those with negative returns, as indicated by the historical performance of Asian equities1. So, how should investors stay calm and ride through market ups and downs?
Volatility is a normal feature of investing, especially when it comes to equities. However, some investors might not be aware that historically, the number of positive years outweighs those that resulted in negative returns. Understanding market psychology – the overall sentiment or behaviour that the market experiences at any given time – provides some revealing insights into the world of investing.
The chart below shows the calendar-year performance of Asian equity markets, represented by the MSCI AC Asia ex Japan Index, from 1994 to 2021 (28 calendar years). The data reveals that the number of years with positive returns (17 years) was higher than those with negative returns (11 years).
What about market ups and downs? For Asian equities, annual market returns rose or declined by over 20% in 12 years. Drilling deeper and despite this volatility, the number of years when returns were up by more than 20% (9 years) outnumbered those when returns fell by greater than 20% (3 years).
As we can see from the chart below, market swings are inevitable, but there was still a greater chance of generating positive returns. The question is: How should investors remain calm and stay invested even when market conditions are stormy?
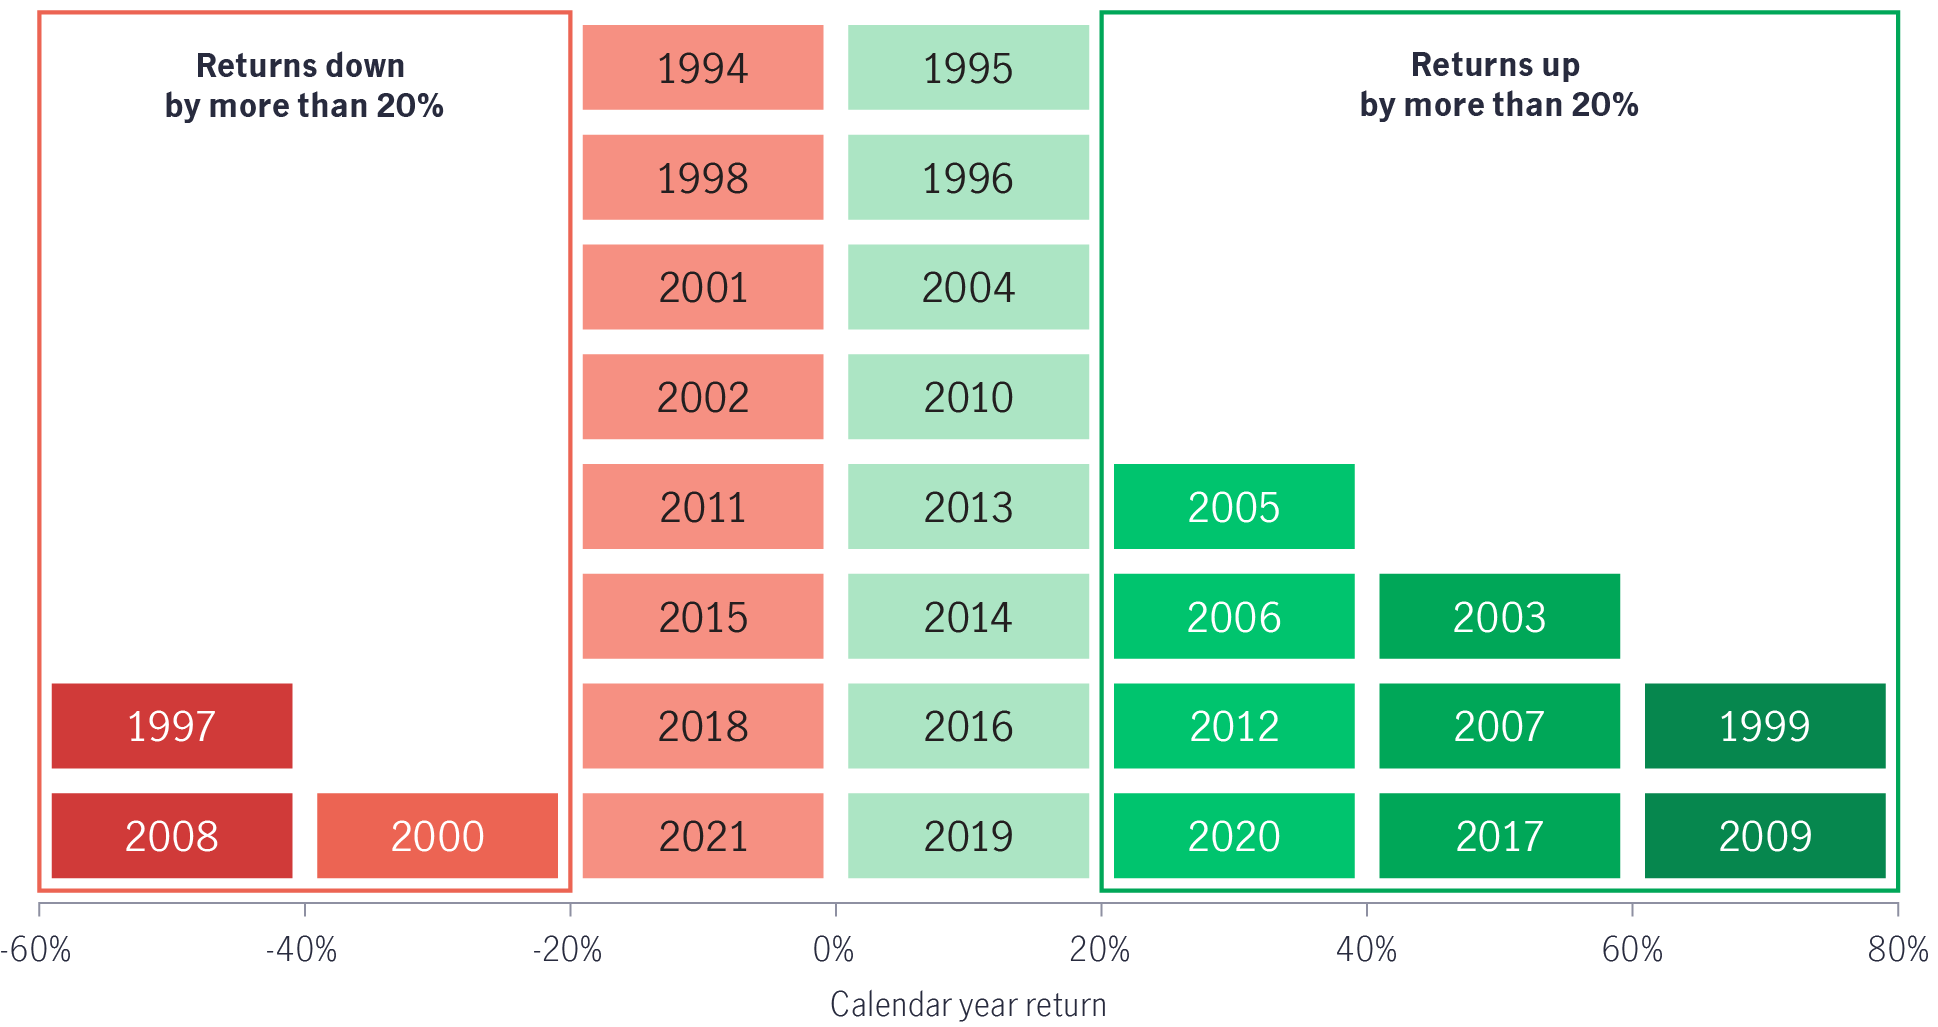
Source: Bloomberg, as of 31 December 2021. Total returns in US Dollar. It is not possible to invest directly in an index. Past performance is not indicative of future performance.
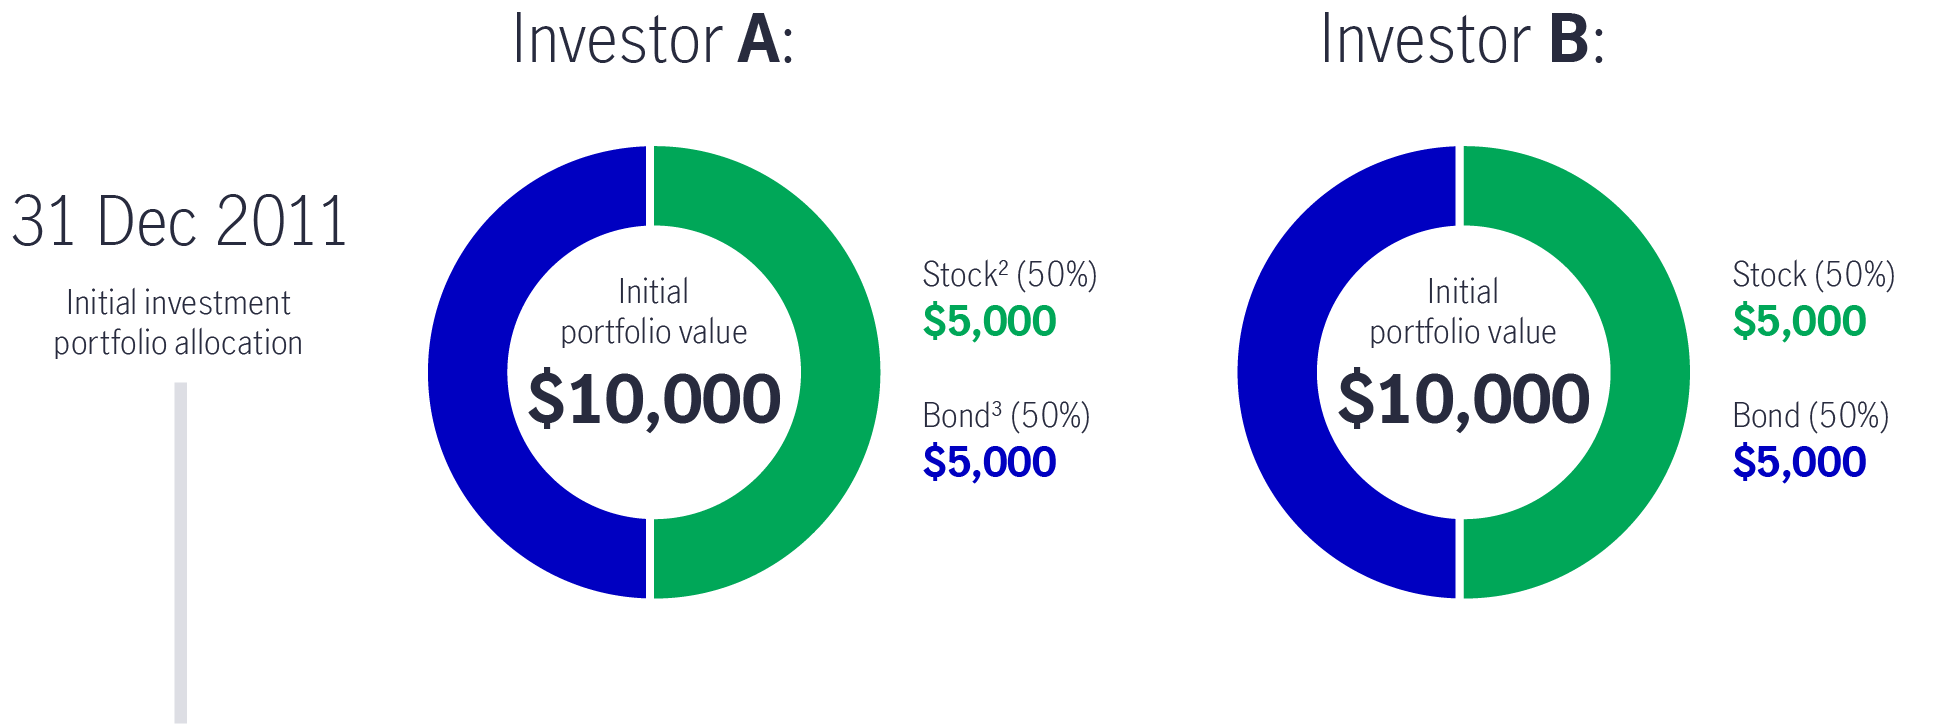
Let's look at a hypothetical example of two investors: Investor A and Investor B. Both invested US$ 10,000 on 31 December 2011, with 50% in stocks and 50% in bonds.
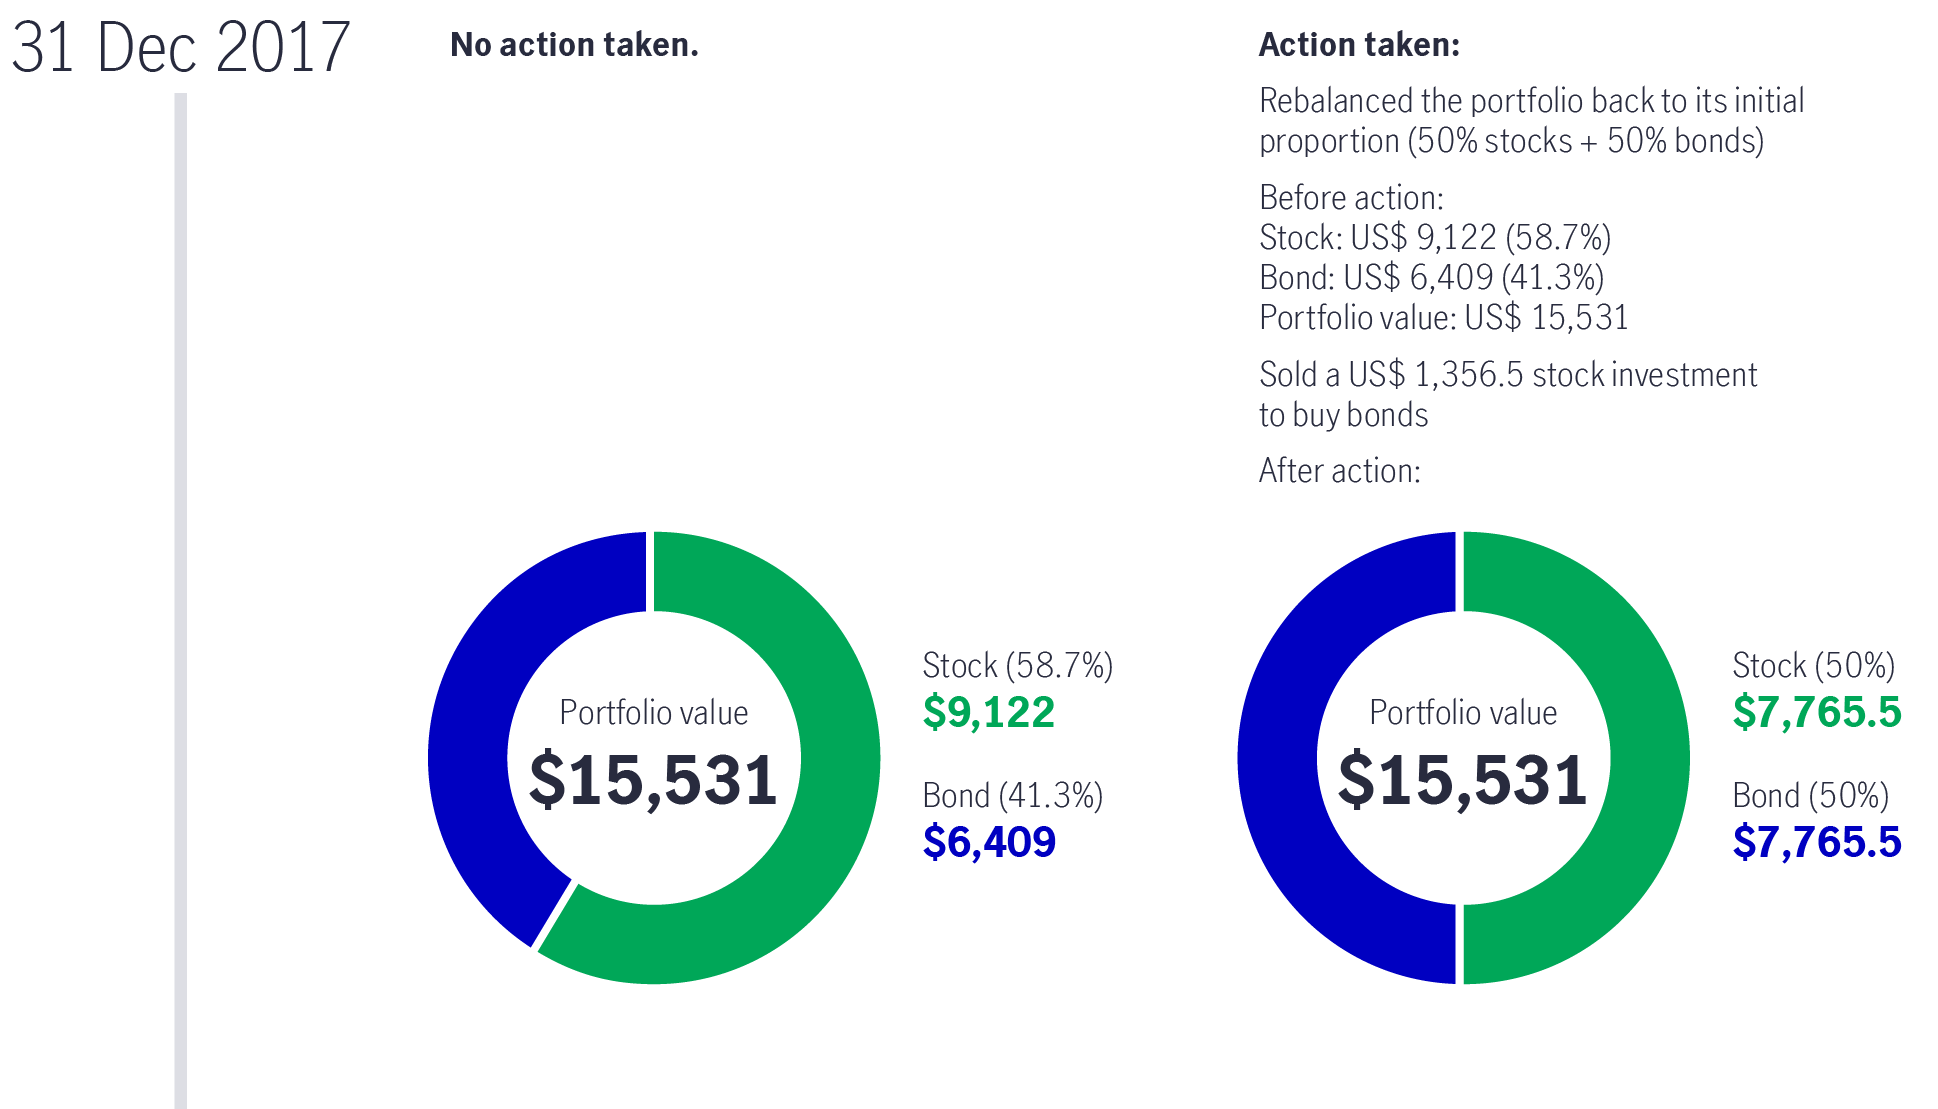
Asian equities ended 2017 on a high due to a strengthening global economy. By the end of that year, Investor A had made no changes to the original allocation. At the same time, investor B performed a review and rebalanced the portfolio back to its initial allocation.
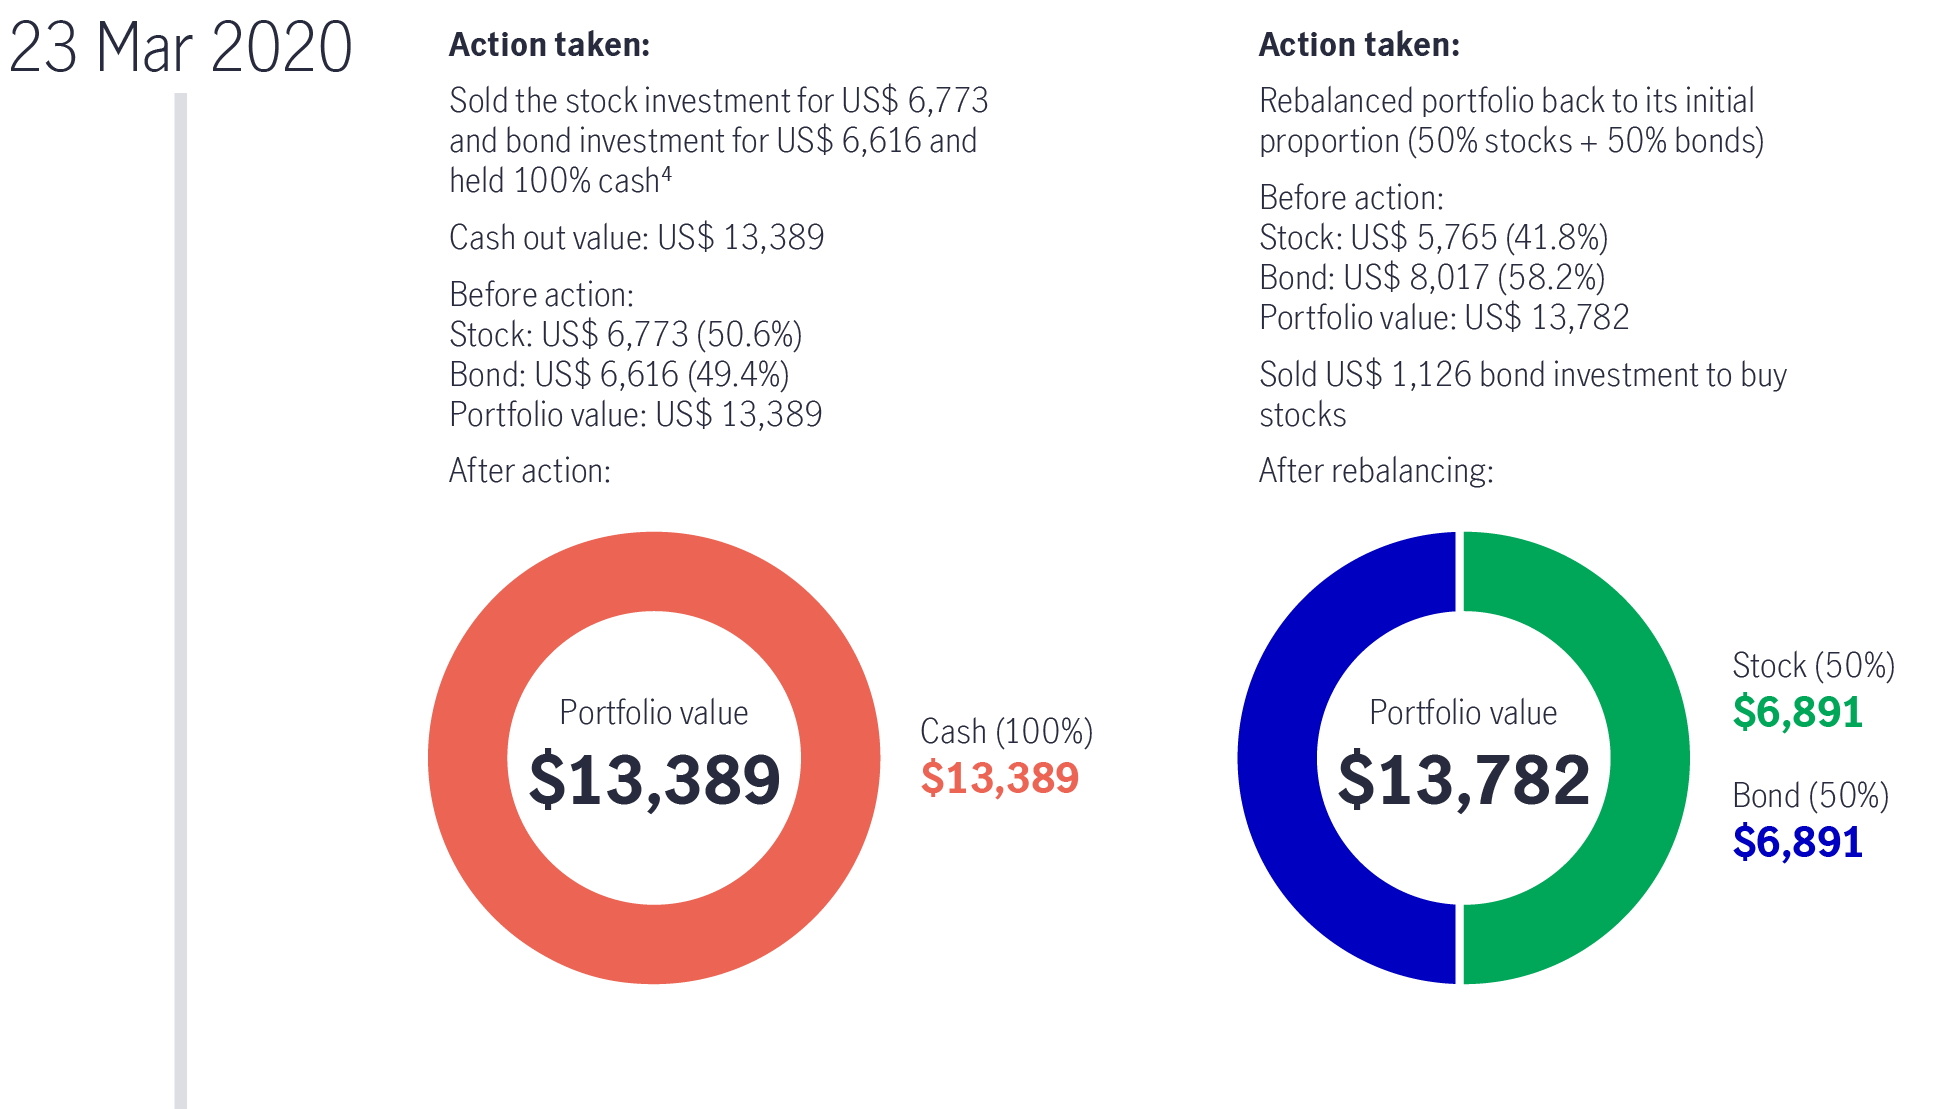
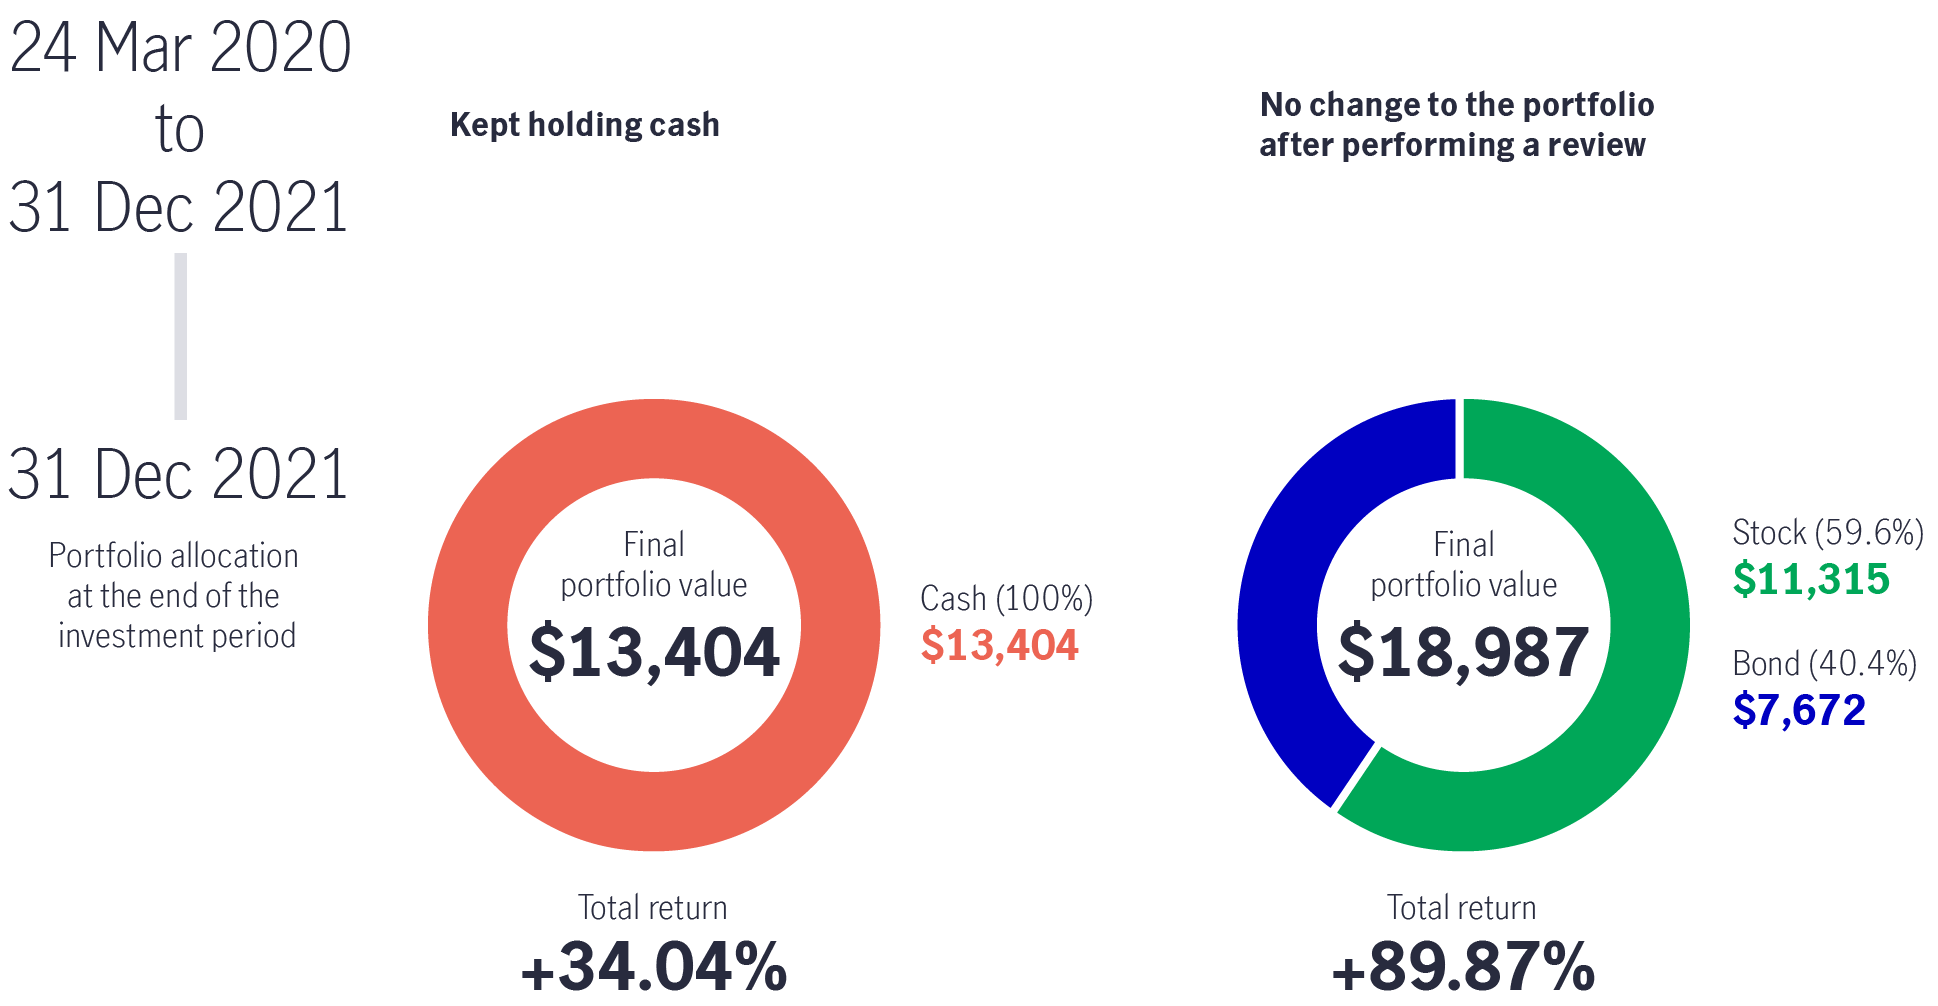
Event: On 23 March 2020, World Health Organization (WHO) declared COVID-19 a global pandemic, which sent the stock market tumbling.
Action: In response, Investor A sold all the stock and bond investments, while Investor B again rebalanced the portfolio by selling bonds and buying stocks.
Outcome: On 31 December 2021, Investor B generated a total return of +89.87%, 1.64 times more than that of Investor A (+34.04%).
The graph below shows how their investment performance varied by adopting different approaches.
Source: Bloomberg, as of 31 December 2021. Total returns in US Dollar. It is not possible to invest directly in an index. Past performance is not indicative of future performance.
Like medical check-ups to detect health issues, it’s important for investors to review and rebalance your portfolio regularly, so your investment remains on track during market rallies and dips. Remaining invested rather than leaving the market immediately could potentially reap better results. In practice, this could mean adjusting a particular segment of your portfolio when markets rise or fall so it doesn’t outweigh or underweight the initial allocation.
1 Asian equities refer to MSCI AC Asia ex Japan Index. This index was launched on 30 September 1993.
2 Stock = MSCI AC Asia ex Japan gross total return US$ index
3 Bond = 50% JPMorgan Asia Credit Index (as of 31 December 2021) + 50% HSBC Asian Local Bond Index (as of 2012)/Markit iBoxx Asian Local Bond Index (1 January 2013 to 31 December 2021).
4 Cash = USD overnight deposit rate
Making your money work for you
Inflation: the unseen tax that gradually erodes investors’ purchasing power
China Fixed Income: From deflation to reflation: what comes next?
Not another bubble: How semiconductors are powering a real future
Semiconductors sit behind almost every modern experience – from smartphones and cars to cloud computing and today’s AI tools – yet they remain largely invisible to most people. They are more than chips only, and the demand is being supported by several long-term forces. We believe that today’s semiconductor excitement is not a repeat of the dot-com bubble, as investment is tied to real infrastructure and revenue-generating services. And the opportunity is broader than a handful of headline AI names.
Making your money work for you
Inflation: the unseen tax that gradually erodes investors’ purchasing power
How to Set Smart and Effective Financial Goals
In previous episodes, we have explored creating a financial plan and establishing a budget that accounts for your current expenditure. The third step is to build a strategy that will help you accomplish either a short-term or a long-term financial goal. We will guide you on your path by providing financial goal examples and introducing SMART (specific, measurable, attainable, relevant, time-based) objectives that help clearly define what you want to achieve in the years ahead.
5 ways a budget plan can help you manage your finances
We all know approximately how much money we need each month. However, without a clear spending strategy, you could see a shortfall in savings, face a lack of day-to-day cash, or be caught off guard by unexpected costs. That’s why it’s important to have an effective budget plan that will give you control over your finances.
![]()
©1999 - 2026 Manulife Investment Management (Hong Kong) Limited