Important Notes:
With market-leading multi-asset expertise, we apply a flexible cross-asset framework and dynamically adjust allocations as the market rotates and correlations shift. This disciplined approach seeks to support durable, long-term capital growth while managing risk in a more systematic way through periods of heightened volatility.
With tactical and dynamic management at its core, the Fund flexibly allocates across diversified assets with a focus on long-term capital appreciation and steady wealth accumulation. The Fund also complements pure income strategies, enhancing overall portfolio resilience and return potential.
Three investment pillars
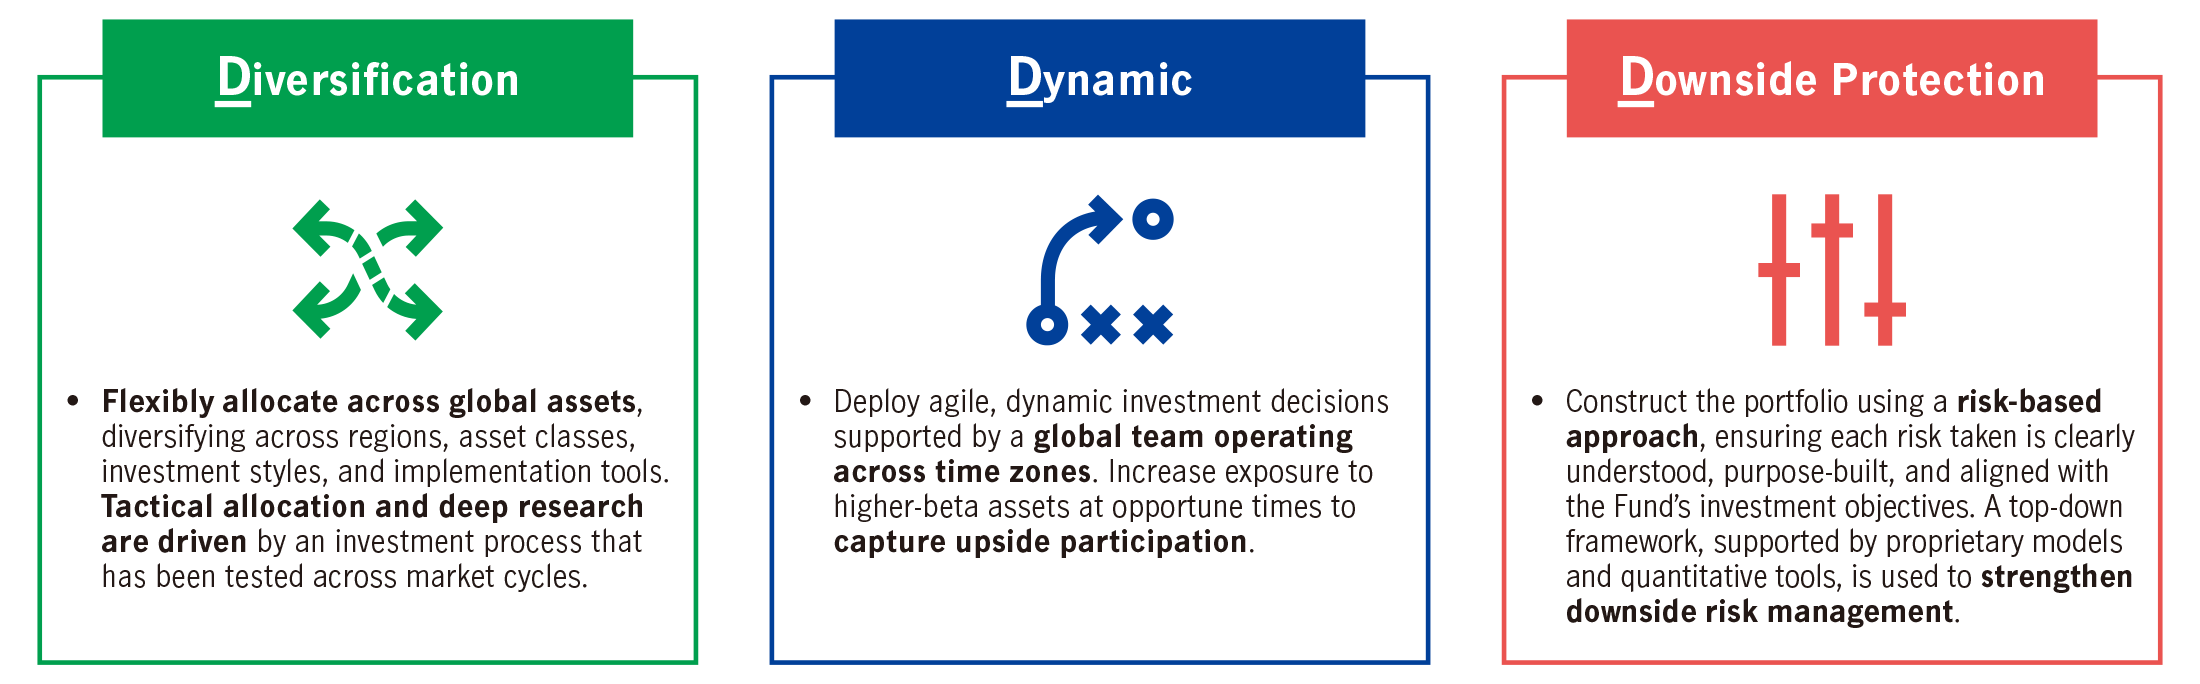
Three investment pillars
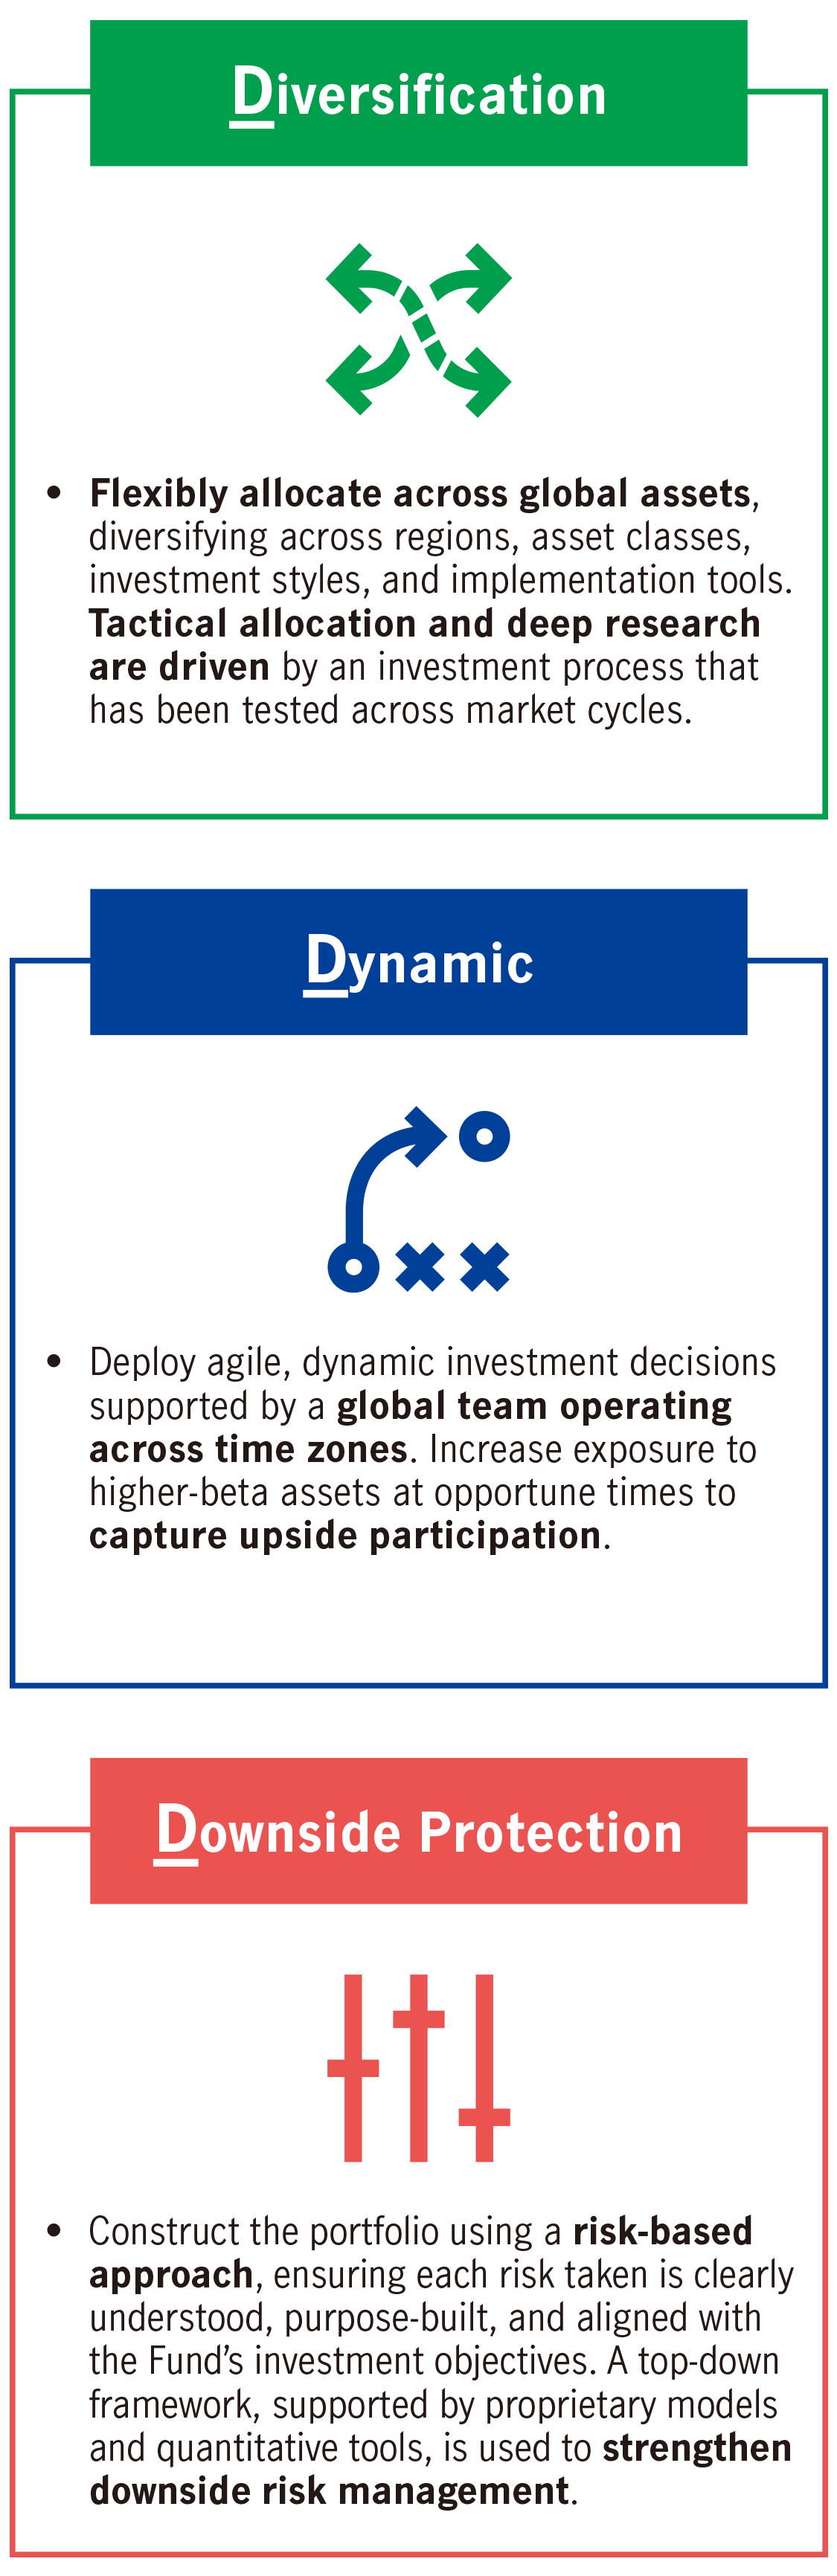
Flexible allocation to drive resilient growth and enhance the Fund’s return potential
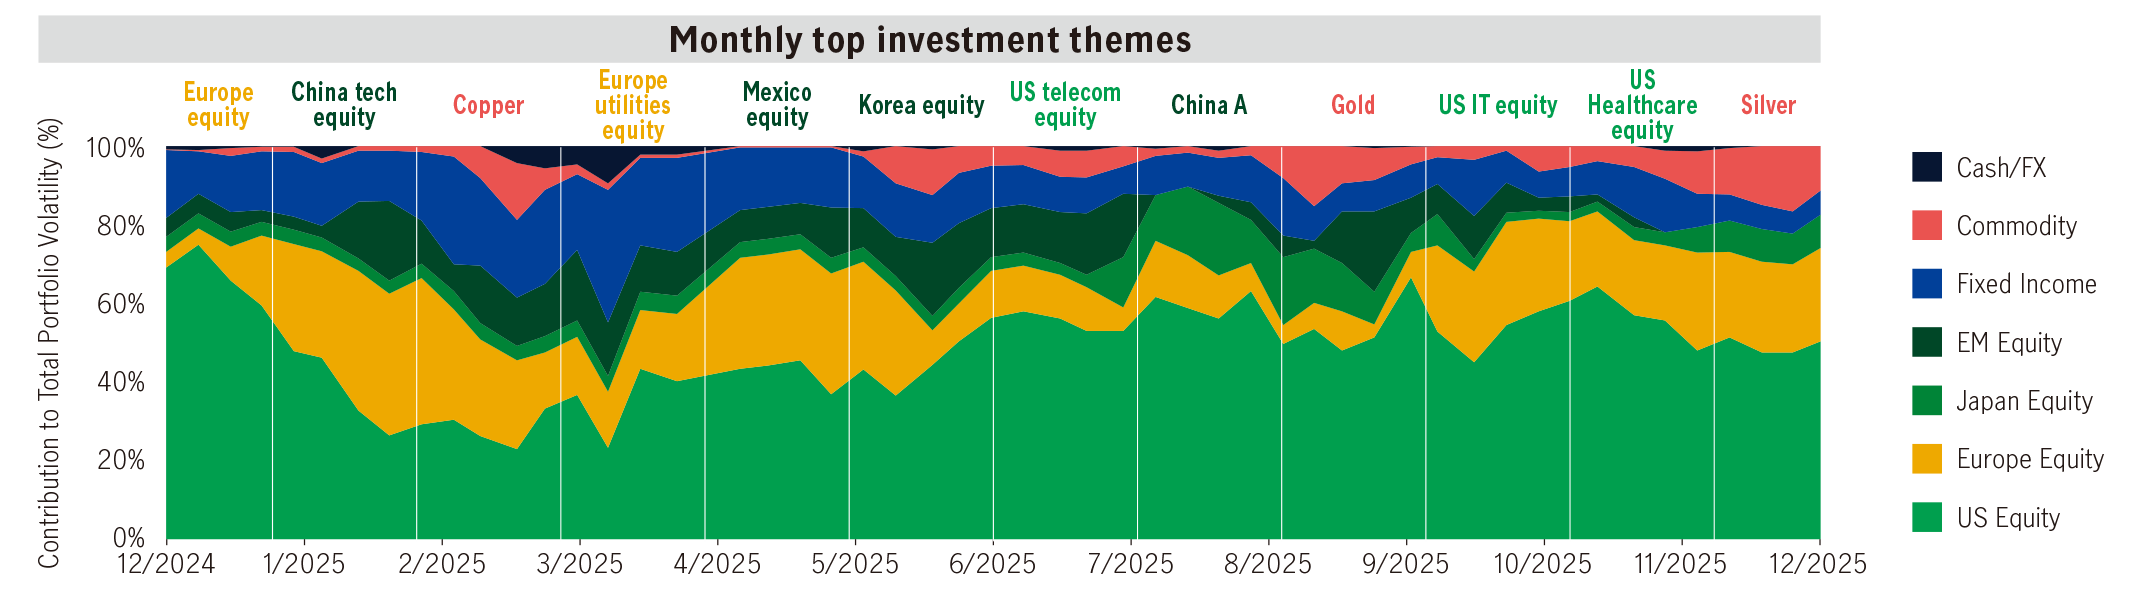
Source: Manulife Investment Management, as of December 31, 2025. The asset allocation information reflects historical data and does not represent the future. Due to rounding, the total may not be equal to 100%. Diversification or asset allocation does not guarantee profit nor protection against loss in any market environment.
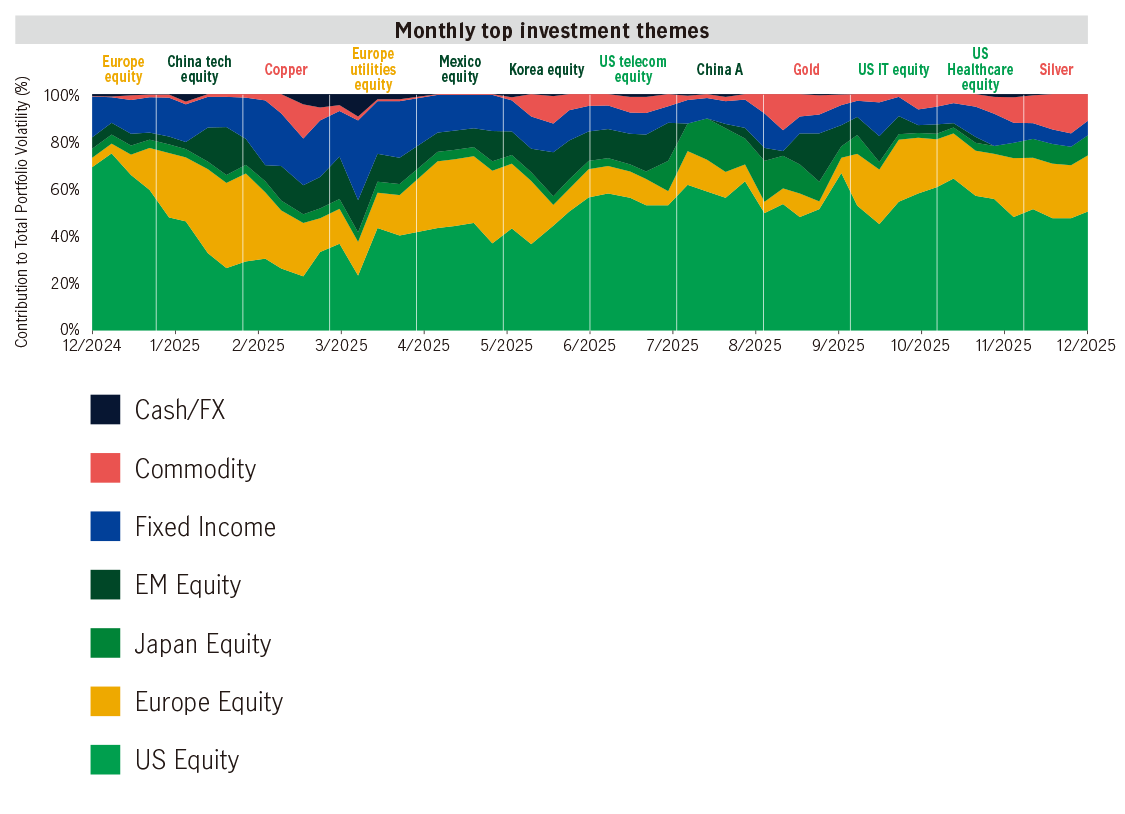
Source: Manulife Investment Management, as of December 31, 2025. The asset allocation information reflects historical data and does not represent the future. Due to rounding, the total may not be equal to 100%. Diversification or asset allocation does not guarantee profit nor protection against loss in any market environment.
Manage downside risk, stabilize volatility and drive capital appreciation
Fund performance over the past three years – Class AA (USD) Inc
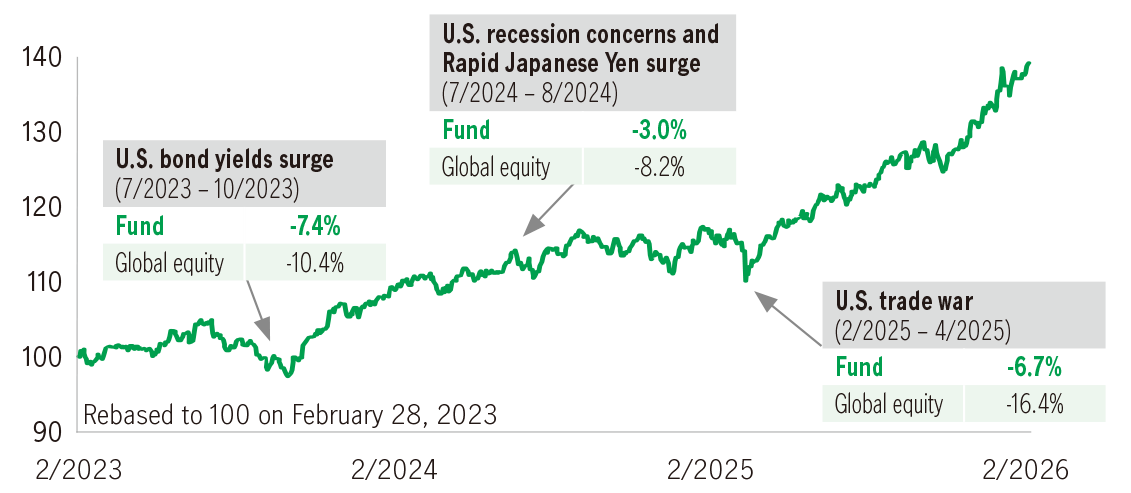
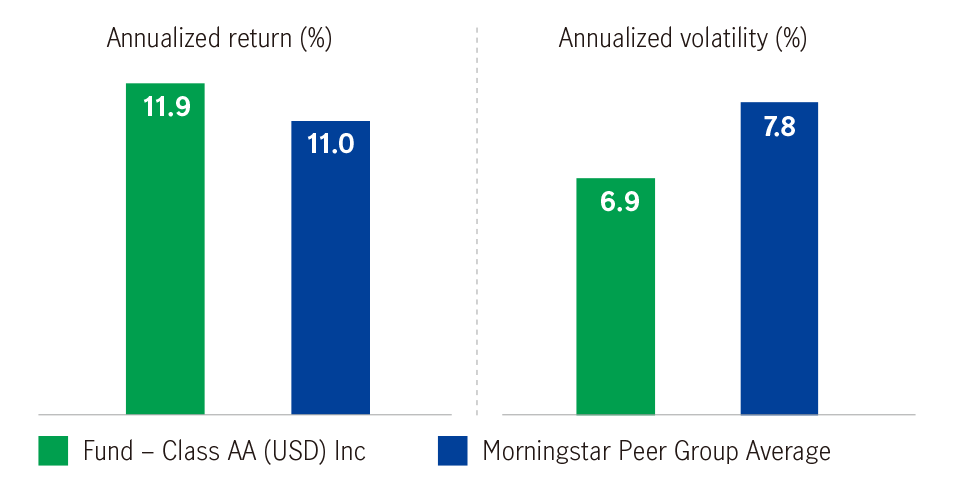
The Fund outperformed its peers over the past three years, with lower volatility
Fund performance over the past three years – Class AA (USD) Inc
The Fund outperformed its peers over the past three years, with lower volatility
Source: Morningstar, Manulife Investment Management, as of February 28, 2026. Fund performance is based on the Class AA (USD) Inc. Returns are calculated on a net asset value (NAV)-to-NAV basis in the Fund’s base currency, with dividends reinvested. Global equities are represented by the MSCI World Index. Morningstar Category™: USD Flexible Allocation (the investment strategy of USD flexible allocation funds is designed for USD‑based investors and does not impose restrictions on asset allocation across asset classes). Investment involves risks. Past performance is not indicative of future results. The historical net returns of the Class AA (USD) Inc over the past five years are: 16.13% (2025); 5.57% (2024); 8.82% (2023); -15.16% (2022); 4.12% (2021). Inception date: November 30, 2015.
* © Morningstar. All rights reserved. As of February 28, 2026. (2) Do not copy or distribute; (3) No guarantee is provided regarding its accuracy, completeness, or timeliness. Morningstar, Manulife, and their affiliates accept no responsibility for any damages or losses arising from the use of this information.
10+ years of unified global research and investment support
24-hour market coverage
The Fund dynamically allocates across diversified assets, with a focus on long-term capital appreciation and overall total return. The Fund aims to achieve lower volatility than pure equity strategies and, when the yield environment becomes less supportive, seeks to enhance diversification benefits and performance potential through multiple global return sources.
Dividend schedule
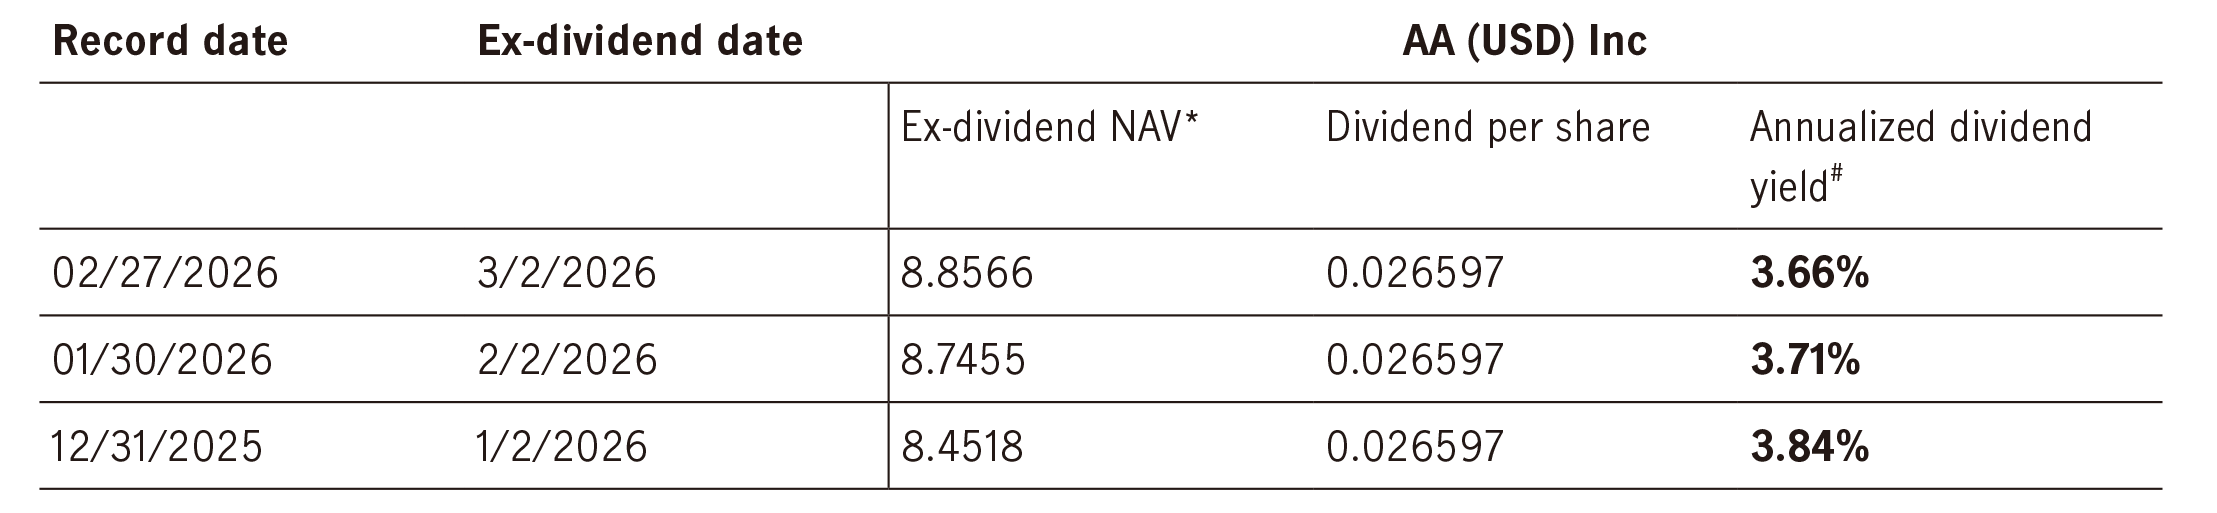
(The distribution yield is not guaranteed. Distribution may be paid out of capital. Refer to Important Note 2.)
Source: Manulife Investment Management, as of March 31, 2026. For illustrative purposes only. Dividend is not guaranteed.
* Applicable to AA (USD) Inc Share class. A positive distribution yield does not imply a positive return.
# Dividend rate is not guaranteed. Dividends may be paid out of capital. Refer to important note 2. Please note that a positive distribution yield does not imply a positive return. Investors should not make any investment decision solely based on information contained in the table above. You should read the relevant offering document (including the key facts statement) of the fund for further details including the risk factors. Past performance is not indicative of future performance. Annualized yield = [(1+distribution per unit/ exdividend NAV)^distribution frequency]–1, the annualized dividend yield is calculated based on the latest relevant dividend distribution with dividend reinvested, and may be higher or lower than the actual annual dividend yield.
Dividend schedule
(The distribution yield is not guaranteed. Distribution may be paid out of capital. Refer to Important Note 2.)
Source: Manulife Investment Management, as of March 31, 2026. For illustrative purposes only. Dividend is not guaranteed.
* Applicable to AA (USD) Inc Share class. A positive distribution yield does not imply a positive return.
# Dividend rate is not guaranteed. Dividends may be paid out of capital. Refer to important note 2. Please note that a positive distribution yield does not imply a positive return. Investors should not make any investment decision solely based on information contained in the table above. You should read the relevant offering document (including the key facts statement) of the fund for further details including the risk factors. Past performance is not indicative of future performance. Annualized yield = [(1+distribution per unit/ exdividend NAV)^distribution frequency]–1, the annualized dividend yield is calculated based on the latest relevant dividend distribution with dividend reinvested, and may be higher or lower than the actual annual dividend yield.
| Fund name | Manulife Global Dynamic Asset Allocation Fund |
Base currency |
USD |
Launch date |
November 20, 2015 |
Available share classes |
AA (USD) Inc; AA (HKD) Inc; AA (USD) Acc; AA (RMB) Inc; AA (RMB) Inc Hedged |
Initial subscription fee1 |
Currently up to 5% of the NAV per share |
Management fee1 |
Currently 0.75 % p.a. |
We are the Global Wealth and Asset Management segment of Manulife Financial Corporation. With more than 160 years of financial stewardship, we serve institutional, retail and retirement investors globally.
25+ years
average investment experience of management team
700+
investment experts across asset classes2
USD179 billion
AUM of multi-asset solutions3
Unless otherwise stated, all information sources are from Manulife Investment Management, as of March 31, 2026. Projections or other forward-looking statements regarding future events, targets, management discipline or other explanations are only current as of the data indicated. There is no assurance that such events will occur, and if they were to occur, the result may be significantly different than that shown here. Investment involves risk. Investors should not make investment decisions based on this material alone and should read the offering document for details, including the risk factors, charges and features of the product. This material has not been reviewed by the Securities and Futures Commission. Issued by Manulife Investment Management (Hong Kong) Limited.
5503259
![]()
©1999 - 2026 Manulife Investment Management (Hong Kong) Limited